- Looking to get into crypto trading?
- Check out this guide on how to better understand the market
Cryptocurrencies can be an attractive opportunity for the amateur investor. Their popularity and mass appeal has worked to break down long standing barriers and biases that put many people off financial investment, with their decentralised nature conveying an anti-establishment sentiment and a sense of rebellion.
However, it can be a risky business. We’ve all heard the horror stories of ill-advised investors jumping into the deep end with their life savings, putting everything at risk. Proper research and planning are crucial to any investment opportunity, crypto included. If you’re an amateur trader, check out this guide to understanding the market. We’ll cover everything, from analysing the charts to specialist tools like MT4 Custom Indicators, to help you kick-start your very own crypto portfolio.
What Is Crypto?
The first thing you need to do before you start investing or trading in crypto is to properly understand what crypto is. This may seem obvious, but having as much knowledge and as clear an understanding as possible will only benefit you in the long run. Knowledge is power and knowing your stuff will pay dividends further down the line.
Cryptocurrency is a digital currency that is held online and secured by cryptography. It uses a peer-to-peer network allowing payments to be made between anyone, anywhere, with its decentralised nature removing the need for an overseeing body or middleman to process transactions. Currency transfers are stored in a publicly accessible digital ledger known as the blockchain.
There are currently more than 10,000 different cryptocurrencies on the market, ranging from the famous Bitcoin to obscure lesser-known altcoins, with more coins appearing every day. Cryptocurrencies can see rapid and extreme fluctuations in price over short periods of time. While this may seem daunting to the layman, it can offer opportunities for significant returns for the shrewd trader or investor. How can a newcomer to the crypto world understand and predict this rapidly changing market landscape? Read on to find out.
Read The Charts
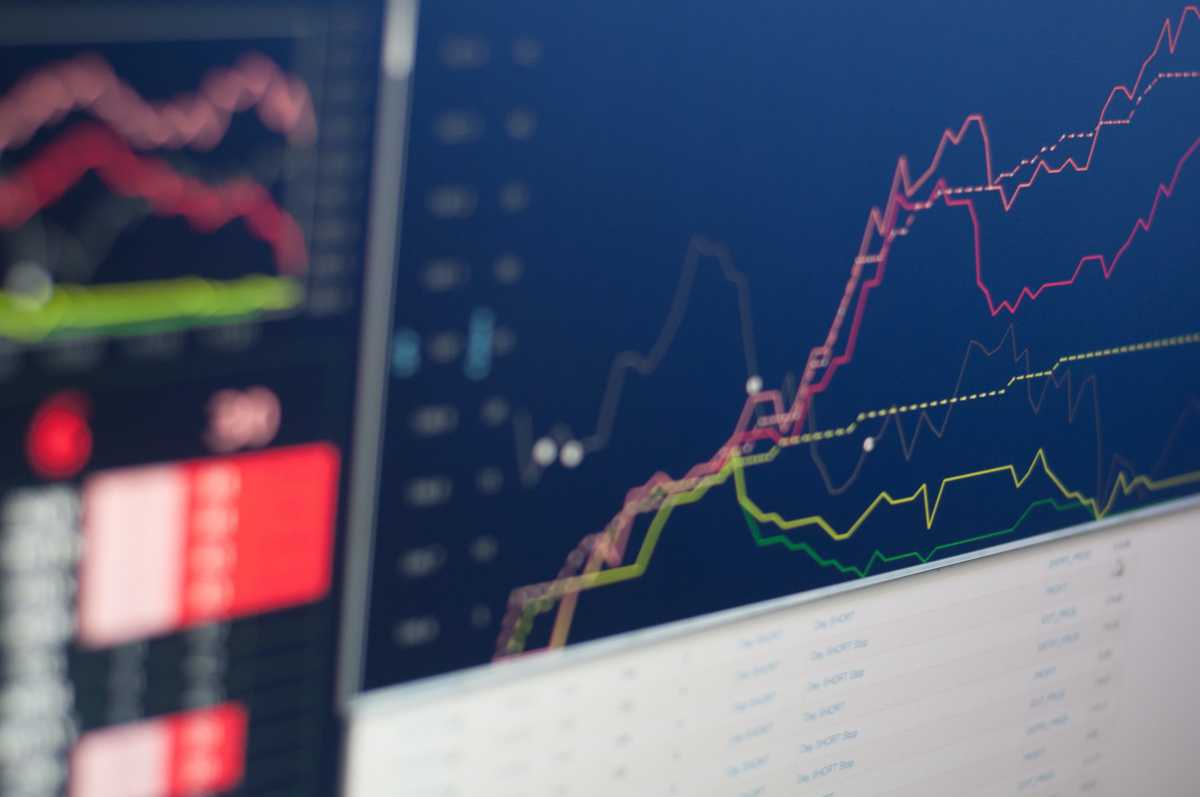
Cryptocurrency values see regular spikes and dips, with these ebbs and flows tracked using special crypto charts. These charts display a range of stats and data figures, plotted to represent market movements so that traders can analyse and understand trends and, hopefully, predict future behaviour.
The basic line chart is the simplest to understand, you will see this used commonly throughout the crypto industry. Line charts are graphs tracking the price movement of a digital asset over a period of time. They can be viewed with different options for currency and timescale, anything from changes over minutes to changes over years. While long-term investors will pay more attention to longer timespans, traders looking to buy and sell assets quickly should focus on shorter timeframes.
Line charts come as either linear or logarithmic. On linear types, prices are divided equally, while logarithmic charts show percentage changes. Linear charts are most useful for analysing how rapidly an asset’s value has changed, while logarithmic versions are more suited for recognising trends.
Candlesticks
For a more advanced insight into the behaviour and movement of a digital currency’s value, more experienced crypto traders will look to the candlestick chart. These charts go into far more detail than line charts, and while being slightly more difficult to read, provide even further opportunities for market analysis and prediction.
Candlestick charts take their name from the visual elements used on the chart, points are plotted with green and red vertical rectangles, with grey lines protruding from the top and bottom of each, much like the wick of a candle.
The rectangles represent the difference in the opening and closing value of a specific currency for the time period specified, with green rectangles representing growth and red representing a fall. The lines, or wicks, represent the highest and lowest price ranges seen within that time period.
Patterns seen on candlestick charts can indicate whether the movement of a currency is bullish or bearish, with bullish defined as showing an upward trend, while bearish means a downward trend. These charts are often used by experienced traders as they offer greater opportunities for making accurate market projections.
Utilise Tools
Learning to read and evaluate charts is the first step in becoming a successful crypto trader. However, to take your trading game to the next level, consider integrating tools and software solutions into your strategies.
Trading platforms, such as MT4, are used to trade cryptocurrencies and other financial assets. Traders and investors can employ specialist tools and software devices to give them additional benefits when operating in the marketplace.
Indicators can be used to notify you about trends or swings in the market. Lagging indicators will provide information on trends as they happen, while leading indicators can work to flag incoming movements before they happen.
Conclusion
The world of crypto trading can be confusing and overwhelming for newcomers. Rapid swings and spikes in currency values can seem chaotic and unpredictable, putting off even the most financially astute of us. However, by following this guide, you’ll be understanding the market and trading effectively in no time.
 Join Daily Trust WhatsApp Community For Quick Access To News and Happenings Around You.